Using DRED to Debug TDR Device Removals in DirectX 12
Intro
One big difference of modern APIs such as DirectX 12 compared to older APIs such as DirectX 11 is that there will be little to no validation of the commands you submit. This makes it much easier to create bugs that will cause errors in the driver which can cause your application to lose the device without an obvious reason why.
In this blog post I will describe a case study in how I used DRED (Device Removed Extended Data) to debug a TDR (Timeout Detection and Recovery) device removal error in my QhenkiX glTFViewer example.
Background
The glTF viewer uses my RHI to render glTF models using DirectX 12 and 11. Models are loaded at runtime asynchronously on a separate thread, including the creation of GPU resources and copying data to them from system memory. Sometimes when loading a model the app’s framerate would drop significantly and then the app would freeze for a few seconds before displaying a TDR device removal error:
D3D12 ERROR: ID3D12Device::RemoveDevice: Device removal has been triggered for the following reason
(DXGI_ERROR_DEVICE_HUNG: The Device took an unreasonable amount of time to execute its commands, or the
hardware crashed/hung. As a result, the TDR mechanism has been triggered.
There is no previous warning or error message from the D3D12 Debug Layer to hint at what was wrong. In comes DRED. DRED can insert breadcrumbs into a GPU command stream to track the progress of an executing command list. After a TDR, you can inspect this info to see what commands were being executed when the TDR occurred, resources that were being used, and more.
Using DRED
Breadcrumbs need to be enabled before you create the ID3D12Device.
CComPtr<ID3D12DeviceRemovedExtendedDataSettings> pDredSettings;
if (SUCCEEDED(D3D12GetDebugInterface(IID_PPV_ARGS(&pDredSettings))))
{
    pDredSettings->SetAutoBreadcrumbsEnablement(D3D12_DRED_ENABLEMENT_FORCED_ON);
    pDredSettings->SetPageFaultEnablement(D3D12_DRED_ENABLEMENT_FORCED_ON);
}
After a TDR occurs, you can write your own code for custom logging, dumping, or analysis:
void MyDeviceRemovedHandler(ID3D12Device* pDevice)
{
    CComPtr<ID3D12DeviceRemovedExtendedData> pDred;
    VERIFY_SUCCEEDED(pDevice->QueryInterface(IID_PPV_ARGS(&pDred)));
    D3D12_DRED_AUTO_BREADCRUMBS_OUTPUT DredAutoBreadcrumbsOutput;
    D3D12_DRED_PAGE_FAULT_OUTPUT DredPageFaultOutput;
    VERIFY_SUCCEEDED(pDred->GetAutoBreadcrumbsOutput(&DredAutoBreadcrumbsOutput));
    VERIFY_SUCCEEDED(pDred->GetPageFaultAllocationOutput(&DredPageFaultOutput));
}
You can also use an extension for WinDbg. After loading the extension, the !d3ddred command can inspect the removal data. In my case it looked like this:
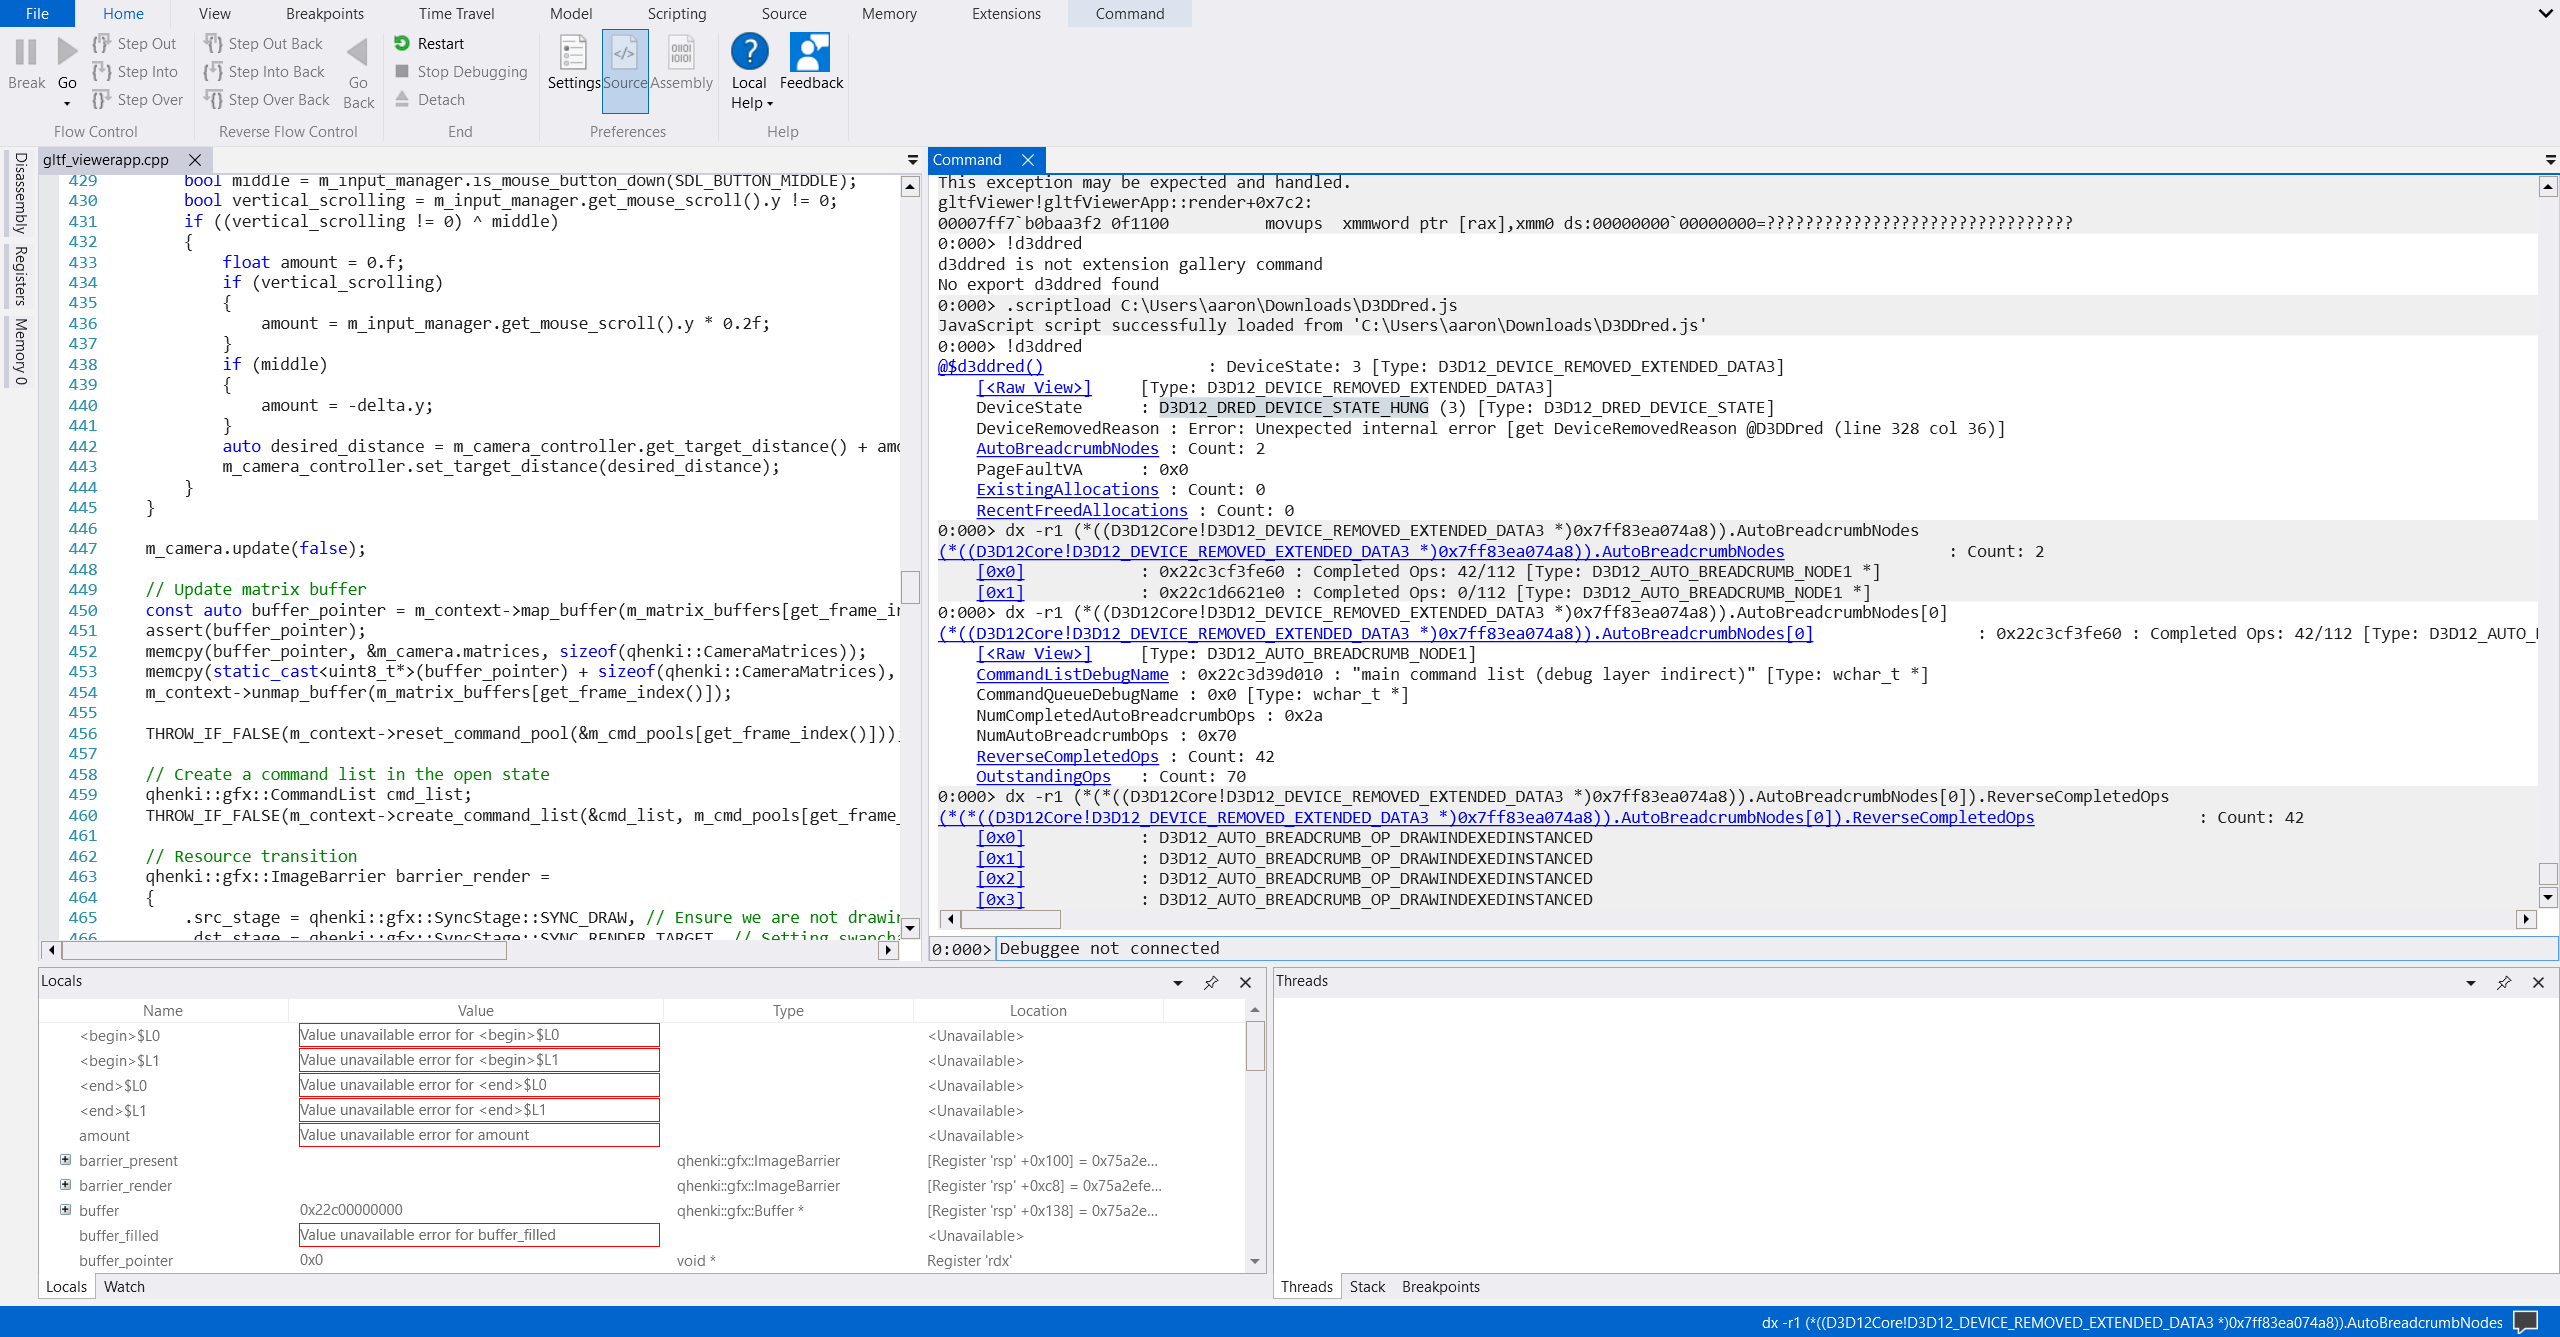
DRED includes a list of completed and outstanding operations. Upon closer inspection, the device hung before or during a plain old DrawIndexedInstanced call.

So something was likely wrong with a specific mesh being drawn. The glTF viewer uses a scene graph where each node can have its own mesh to draw. Looking at the struct below:
struct Node
{
  std::string name;
  int parent_index = -1;
  int mesh_index;
  qhenki::Transform local_transform;
  struct
  {
    qhenki::Transform transform;
    bool dirty = true;
  } global_transform;
  std::vector<int> children_indices;
};
I forgot to give a default initialization to the mesh_index field. Adding = -1 seemed to fix the issue as I could no longer reproduce the TDR error. My guess is that the app would use the uninitialized index for the mesh to be drawn, which would then refer to invalid resources such as vertex/index buffers or descriptors bound in the shader.
Alternatives and Complements to DRED
DRED is not the only way to debug TDR errors. A good complement is GPU based validation, which can catch the use of invalid descriptors or descriptors that refer to invalid resources. If you are okay with a platform-specific solution, NVIDIA Nsight Aftermath can generate crash dumps for inspection in Nsight Graphics.